
| Bad Astronomy |
|
|
|
BA Blog
|
|
Q & BA
|
|
Bulletin Board
|
| Media |
|
|
|
Bitesize Astronomy
|
|
Bad Astro Store
|
|
Mad Science
|
|
Fun Stuff
|
| Site Info |
|
|
|
Links
|
| RELATED SITES |
| - Universe Today |
| - APOD |
| - The Nine Planets |
| - Mystery Investigators |
| - Slacker Astronomy |
| - Skepticality |
Buy My Stuff

Keep Bad Astronomy close to your heart, and help make me
filthy rich. Hey, it's either this or one of those really
irritating PayPal donation buttons here.
The Parallel Universe
Week of June 23, 1997I have decided this week to break from the tradition of the usual small-scale snack. I am doing this because of an exciting new project with which I am involved, and I want to have it out for the public to see. This involves Hubble Space Telescope, a little bit of extragalactic astronomy and the amazing ability of humans to peer into the Universe around them. For those that check in on this page every week, it will be a change of pace, but for everyone, I suggest opening wide. This week's snack is a doozie.
[There are a lot of acronyms in this week's snack. If I had to write out "Space Telescope Imaging Spectrograph" every time, I'd go nuts. So whenever I will use an acronym, I'll spell it out first and put the abbreviation in parentheses. I don't work directly for NASA (an acronym itself!) but I've been around it long enough to gain an appreciation for Three Letter Acronyms (TLA's). ;-) ]
The Parallel Program
Regular readers are already familiar with the Space Telescope Imaging Spectrograph (STIS). This is one of two cameras installed on board the Hubble Space Telescope (HST) in February of 1997. Several upgrades were made to HST during the servicing mission, and one of the most important, though under-appreciated in the popular press, was a solid-state data storage device. Before the servicing mission, data from the cameras on HST were stored using a tape recorder, and then dumped down to Earth. However, STIS and its sister camera, the Near Infrared Camera and Multi Object Spectrograph (NICMOS), create so much data that the old tape recorder couldn't keep up. So the solid state recorder was installed, which has much higher transmission capabilities. So high, in fact, that it can record data coming in from all three major cameras on board HST- STIS, NICMOS and the Wide-Field Planetary Camera (WFPC2)-at the same time. This created an amazing capability in HST: the parallel program.
Suppose some astronomer is using WFPC2 to look at some object. Normally, STIS and NICMOS would be sitting idle. However, that is a waste of precious Hubble time. Imagine now that NICMOS and STIS were turned on and observing while the WFPC2 was as well. They would be pointed at more-or-less random points on the sky: near the WFPC2 field, but offset a bit. Unlike the primary camera, which is deliberately aimed at some interesting object, the other cameras would be taking images of wherever they happened to be pointing. That is why they are called parallels; the three cameras are running in parallel with each other, all taken data at the same time. An extraordinary decision was made by the people that run HST: they decided that the parallel data should be made public immediately, instead of keeping it proprietary for one year as is usually done. This means that as soon as the data are put into the archive, any astronomer in the world has access to it. That's why I am able to present this information to you now! There's a tremendous wealth of information in these parallels, and they are free for the taking. Any scientist who can justify access can get them at any time and work on them.
Taking a Closer (and deeper) Look
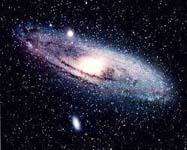
 The image to the left (click it to see a larger, higher
resolution image) is a Palomar Sky
Survey image of a field near the Milky Way's nearest
spiral galaxy neighbor, the famous
Andromeda Galaxy, also called M31 (this is a fairly
easy naked eye object in the early
Fall). Note the elliptical blob to the upper right of
the tremendous spiral; that is a dwarf
galaxy that is a satellite of M31, and can be seen
through just about any small telescope.
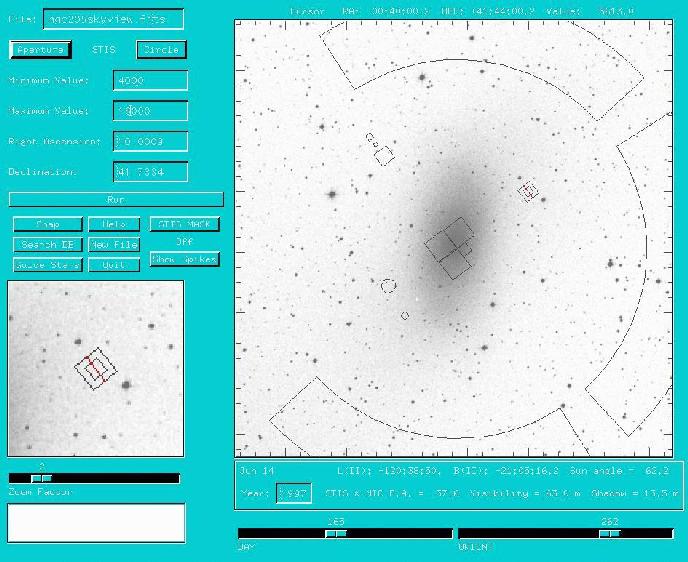
This galaxy is named NGC 205. The image to the right
is an example of a single HST
pointing (click it to see a larger, higher resolution image).
This image is the output of a
sophisticated piece of software that tells you just
where all the instruments are pointing
if you know the coordinates on the sky and the date.
The whole image represents what
you would see on your computer if you ran the software,
and is a collection itself of
smaller images. The large picture on the right is
the field of view of Hubble. In this
case, on June 16th, WFPC2 (denoted as the step shape,
or as I like to call it, a Stealth
bomber shape) was pointed deep in the center of
NGC 205. The other instruments'
outlines represent where they were pointed at this time;
NICMOS detectors are the three
differently sized squares to the upper left of the
WFPC2 field and STIS is the square to
the upper right. The large arc-shaped regions are the areas observed
by the telescopes
that are used to guide HST.
The image to the left (click it to see a larger, higher
resolution image) is a Palomar Sky
Survey image of a field near the Milky Way's nearest
spiral galaxy neighbor, the famous
Andromeda Galaxy, also called M31 (this is a fairly
easy naked eye object in the early
Fall). Note the elliptical blob to the upper right of
the tremendous spiral; that is a dwarf
galaxy that is a satellite of M31, and can be seen
through just about any small telescope.
This galaxy is named NGC 205. The image to the right
is an example of a single HST
pointing (click it to see a larger, higher resolution image).
This image is the output of a
sophisticated piece of software that tells you just
where all the instruments are pointing
if you know the coordinates on the sky and the date.
The whole image represents what
you would see on your computer if you ran the software,
and is a collection itself of
smaller images. The large picture on the right is
the field of view of Hubble. In this
case, on June 16th, WFPC2 (denoted as the step shape,
or as I like to call it, a Stealth
bomber shape) was pointed deep in the center of
NGC 205. The other instruments'
outlines represent where they were pointed at this time;
NICMOS detectors are the three
differently sized squares to the upper left of the
WFPC2 field and STIS is the square to
the upper right. The large arc-shaped regions are the areas observed
by the telescopes
that are used to guide HST.
Now look at the smaller picture on the left. It is a close-up of just where STIS was pointing when the observations were made. There are two detectors in STIS, and they are represented by the concentric squares (the red line across the middle represents a function of STIS that isn't important here). Note that in this image, you cannot see a single star in STIS's field of view. Keep that in mind for a few minutes...
The STIS Parallel Image
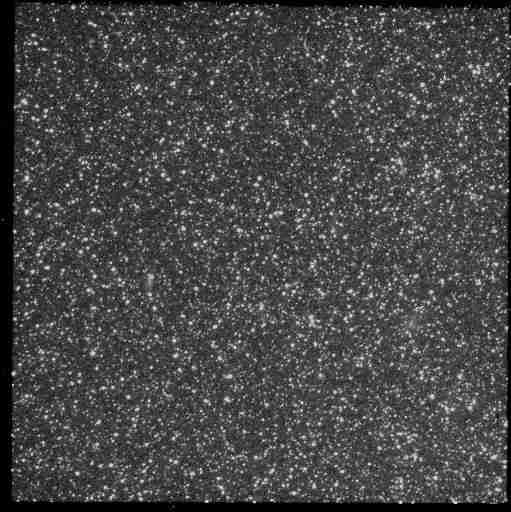
In this case, WFPC2 was looking at NGC 205 for a long time. STIS managed to look at the same spot on the sky for almost two solid hours, and 900 seconds of that was devoted to pure imaging. The image above is the resulting STIS image. It's full of stars! There are so many stars in the image that my software repeatedly barfed every time I tried to count them; but there are at least 10,000 stars in this picture. Part of my job working on STIS is to determine how efficient it is; that is, given a star's actual brightness, how long would it take STIS to see it clearly? Using that information, I determined that the brightest star in this image (seen in the upper left very near the edge, about 1/5 of the way down from the top; it looks like a very tight double star) is about 23rd magnitude, or six million times fainter than be seen by the naked eye! And that's the brightest star; the dimmest you can see here (take your pick!) is about magnitude 28.5, or one billion times fainter than you can see with the naked eye! Imagine: go outside on the absolute darkest night there is, and peer closely at the sky. The very faintest star you can see without aid is still a billion times brighter than the dimmest star in that STIS image. That's about the same ratio of the dimmest star you can see with your eye compared to the brightness of the Sun!
The stars you see in that image are probably a combination of very dim stars in our own Milky Way and stars that are in NGC 205. At that distance, the Sun itself would be about 29th magnitude, or maybe just possibly visible in this image (NGC 205 is about 2.2 million light years away). But it gets better. Look in the center of the STIS image, about halfway to the left hand side. See that fuzzy blob? That is probably yet another, even more distant galaxy that we are seeing straight through NGC 205 (just like we are seeing NGC 205 through our own Galaxy). If you look at the image for a few minutes you'll find a handful of fuzzy blobs which are also most likely distant galaxies. The power of parallel imaging becomes apparent: these galaxies are almost certainly uncatalogued, since STIS is looking deeper and with better resolution than this region has ever been mapped. You are seeing objects that up until a couple of weeks ago were never seen before. And we got them for free!
And it still gets better: remember how I said that the image was 900 seconds long, but that we actually had two hours of observations? The rest of that time was used to take spectra of this region. A spectrum is what you get when you break up the light of an object into its individual colors; a rainbow is a spectrum of sunlight made by raindrops in the air. In astronomy, spectra have two extraordinarily important features: they let you determine the composition of an object (literally, what elements it is made of, like hydrogen or oxygen), and they can tell you the distance to the object. In the latter case, we can take spectra of these far away galaxies and actually figure out with some degree of certainty just how far away they really are. The program is still young, but we have many scientists working on how to work with the data. We are working on a way to automatically go through the data and find galaxies so that we can determine their distance. We are literally trying to measure the very Universe itself.
We get on average a dozen or so STIS parallel images every day. We estimate that over STIS's lifetime, about 70-80 % of all its data will be in the form of parallels. It may take decades, or longer, to properly analyze this huge goldmine of data. It makes me shake my head in wonder to think that kids getting into elementary school today (or maybe even my toddler daughter!) may someday be analyzing this data, and learn something from it.
[DISCLAIMER: This page has absolutely no official affiliation with the Hubble Space Telescope, the Space Telescope Science Institute, NASA, or anyone else. It is my own doing, and I claim responsibility for all conclusions and mistakes made here!]
|
|
| THE PANTRY: ARCHIVE OF BITESIZE SNACKS |
|
|
| Subscribe to the Bad Astronomy Newsletter! |
| Talk about Bad Astronomy on the BA Bulletin Board! |